How Lender CRE Portfolio Concentration Limits Affect Deal Placement
Banks' internal portfolio limits, not regulatory thresholds, determine which deals get funded.

Lender concentration limits, not deal quality, decide who gets a "yes" on any given commercial real estate submission on any given week. The 300%/100% supervisory thresholds set by federal regulators, combined with the internal sub-segment caps banks build on top of them, function as a hidden filter that determines which lenders can even look at a deal, and a sponsor's best execution now depends on knowing where each lender sits in its own portfolio cycle at the moment of submission.
The 300%/100% thresholds and their triggers
The rule dates to 2006, when the FDIC, the OCC, and the Federal Reserve jointly issued the Interagency Guidance on Concentrations in Commercial Real Estate Lending, and that guidance still shapes what examiners expect from banks today. One looks at construction and land development loans on their own: if those loans reach 100% of Tier 1 capital plus the allowance for credit losses, that alone is enough to draw attention. Both conditions have to be true at once, which is a detail lenders and their examiners take seriously, since a bank that is large and concentrated but has grown slowly reads differently from one that got there fast.
What counts as "CRE" for that 300% math is narrower than the term suggests in everyday use. It covers loans where repayment depends on the property being sold, refinanced, or leased out, so construction and land loans, multifamily, and non-owner-occupied commercial buildings all count, while a company financing the warehouse it operates out of generally does not. Crossing 300% is a supervisory trigger, not an automatic violation or enforcement action by itself. It is a supervisory trigger, a flag that pulls the bank into a different kind of conversation with examiners, one that requires board-level governance, a written risk appetite statement, and documented underwriting and stress-testing protocols. A bank sitting well above 300% can still walk away with a satisfactory safety-and-soundness rating if it can show its risk management holds up. Examiners are asking whether the bank understands why it's above the number and can manage the exposure with a straight face.
The guidance has been reaffirmed repeatedly rather than loosened. The FDIC's 2023 advisory (FIL-64-2023) restated the original thresholds word for word, the OCC flagged CRE concentration as a heightened area of focus in its fiscal 2023 supervision plan, and a September 2024 GAO report found that CRE risk has been rising while regulators keep identifying high-concentration banks for closer monitoring. None of that has softened with time. And concentration doesn't only build up loan by loan. A bank at 200% that acquires a CRE-heavy portfolio through a merger can cross 300% before it originates a single new dollar, so the ceiling can arrive overnight through M&A rather than only through years of steady lending.
The number of banks above the threshold and their portfolio composition
The scale here is not a fringe phenomenon. At year-end 2024, roughly 1,374 FDIC-insured institutions, about 31% of all of them, sat above the CRE concentration threshold, and mid-sized banks in particular cluster with median concentrations parked right around the 300% line RiskTemplates. For community and regional banks specifically, CRE loans typically make up 40% to 60% of total credit exposure, and in plenty of cases that stretches well past what regulators would call comfortable BankRegReports.
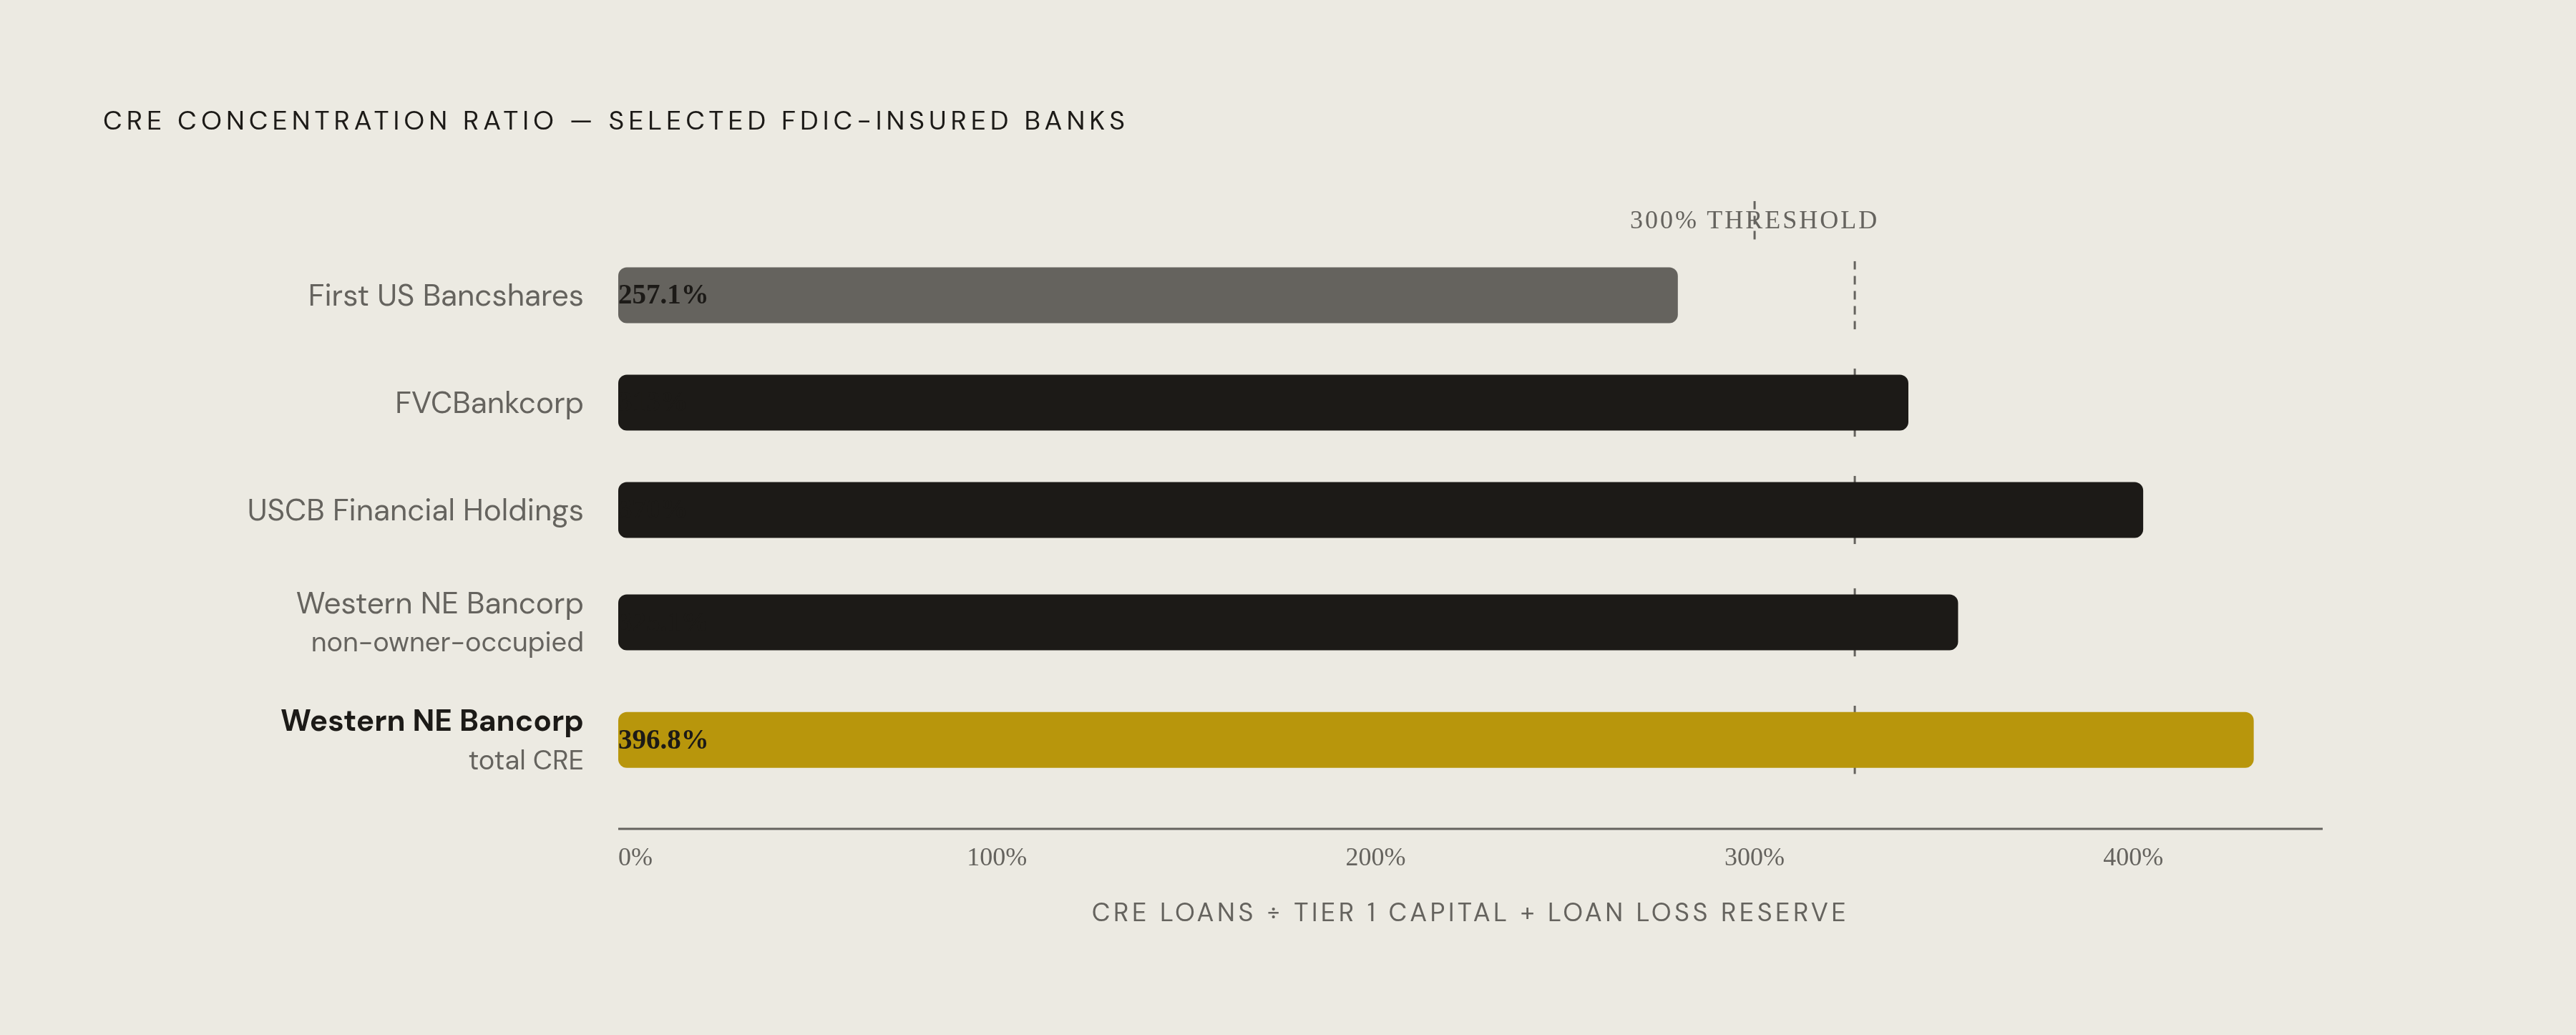
Actual FY2025 filings make the range concrete. Western New England Bancorp reported total CRE at 396.8% of consolidated bank risk-based capital, with non-owner-occupied CRE alone at 325.1% Western New England Bancorp, Inc. - Form ARS - FY2025. FVCBankcorp reported CRE at 313% of total risk-based capital. USCB Financial Holdings put its ratio at 370% and described itself in its own filing as concentrated.
Size matters here in a fairly linear way. Geography compounds this: Florida, Texas, California, and New York, all states with dense CRE markets, show disproportionately high exposure among regional lenders operating there, and smaller banks in secondary markets, often unable to diversify by property type even if they wanted to, remain exposed. None of this is theoretical stress. The FDIC's 2026 Risk Review put the CRE past-due and nonaccrual rate at 1.45% in 2025, with office and retail carrying the bulk of that pressure FDIC 2026 Risk Review. First US Bancshares: CRE at 257.1% of total regulatory capital, below the headline threshold, illustrating the spectrum (FIRST US BANCSHARES, INC. - Form ARS - FY2025). Community banks with $1B–$10B in assets constitute the highest concentration cohort, with limited geographic diversification and portfolios heavily tied to local CRE cycles. Regional banks with $10B–$50B in assets generally show lower concentration, but a substantial share still exceed 300%, and three of four regional banks report commercial mortgages for nearly half their portfolios, per the Wharton Initiative on Financial Policy and Regulation. Large banks with $50B+ in assets show the lowest concentration, reflecting diversification across property types and regions.
Sub-Segment Limits Inside the 300% Ceiling
The 300% figure is a ceiling on total CRE exposure, but it's not the number that actually kills most individual deals. Banks set their own internal limits by property type, by geography, and by loan structure, and those sub-segment caps, not the headline ratio, close the door on a given submission. A bank at 300% split across stabilized multifamily and industrial carries a fundamentally different risk profile than one at 250% concentrated in speculative office construction, and examiners evaluate that composition, not just the aggregate number.
A defensible sub-segment policy, according to RiskTemplates, generally needs board-approved limits by property type, such as a specific cap on office as a share of Tier 1 capital, along with separate treatment for construction and land development loans under the standalone 100% test. Chief credit officers also run stress scenarios that make those internal limits tighter over time rather than looser: cap rate expansion, occupancy declines, cost overruns on construction, rates staying elevated longer than expected, and refinance proceeds landing below what underwriting originally assumed. When those scenarios get modeled at the portfolio level, the room left over for new exposure in an already-stressed sub-segment keeps shrinking. Examiners themselves have shifted how they look at this. Instead of reviewing loans one at a time, the trend, as the Invictus Group has noted, is toward strategic-level review of how CRE concentration interacts with capital adequacy and board governance overall, which raises the cost of granting any exception to an internal limit.
For a sponsor, the practical result is blunt. A well-underwritten office deal submitted to a bank that has already hit its internal office sub-segment cap gets passed on, no matter how strong the deal is, and the bank has no real reason to explain that the rejection was about portfolio math rather than credit quality. This caution comes from concrete conditions, not abstraction. Federal Reserve research tied CRE concentration to a higher likelihood of bank failure during the 2008 crisis, and FDIC analysis found that concentration combined with weak risk management was a major driver of past asset quality problems and failures. That history is precisely why today's credit officers treat sub-segment discipline as non-negotiable.
The maturity wall compresses the timeline and concentrates the pressure
Timing makes all of this worse. That waiting game didn't make the maturities disappear, it just stacked them into a narrower window, which compresses the triage period lenders now have to work through. Office vacancy above 20%, as reported by Cushman and Wakefield and cited by Deluair, shows that the pain is not spread evenly across property types, even though the maturity calendar doesn't care about that unevenness.
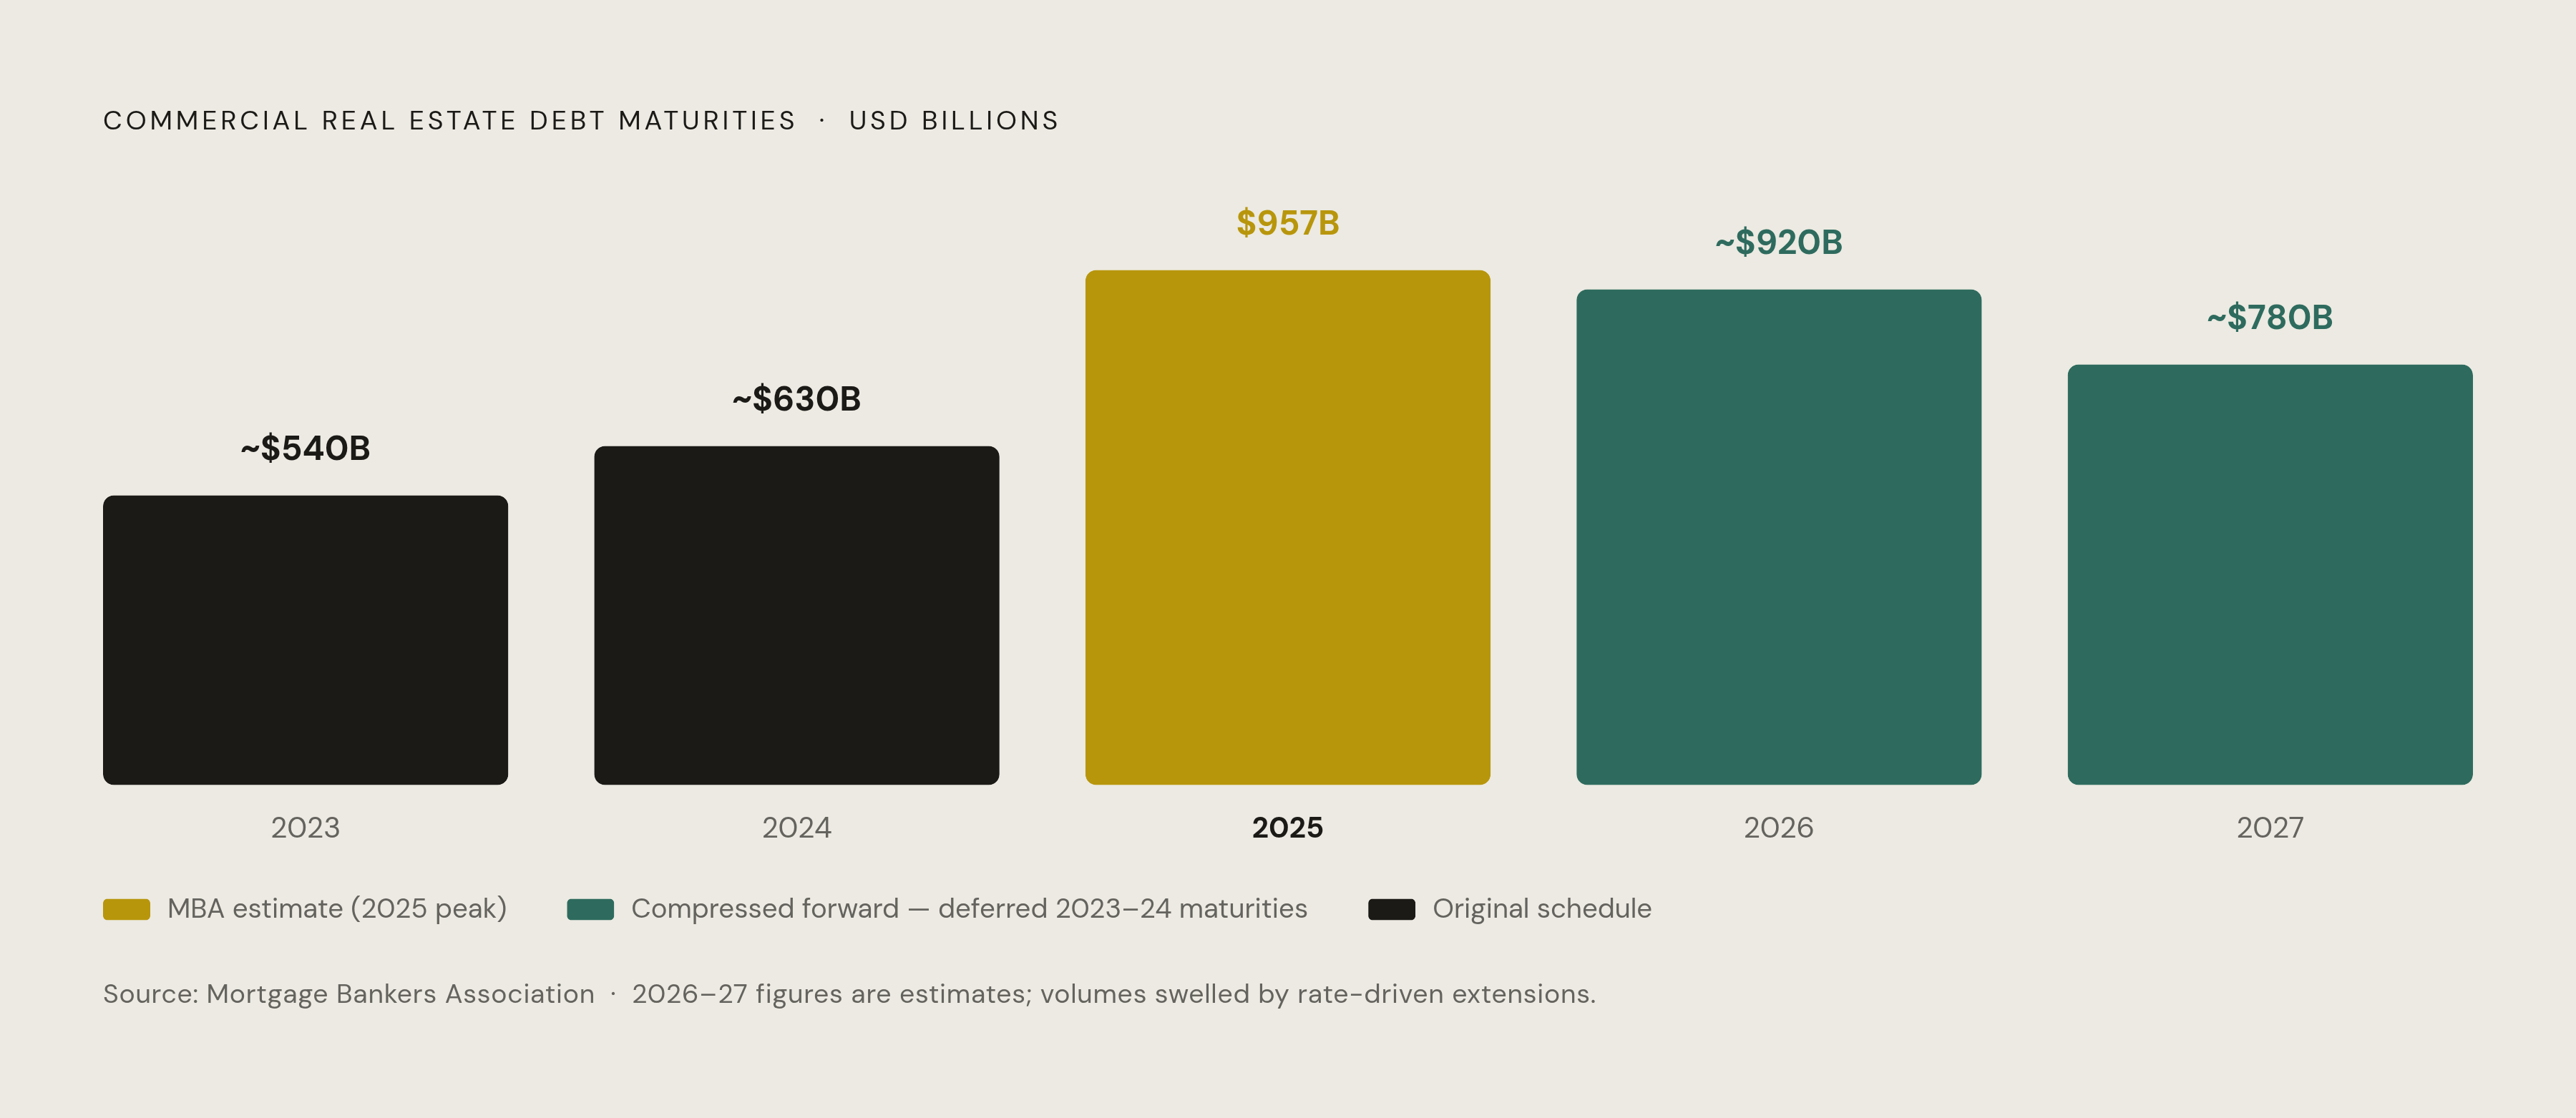
The maturity wall is also a lender portfolio problem. It's a lender portfolio problem too, since banks already sitting high on CRE concentration are the same ones fielding refinance requests on loans already sitting on their own books, and refinancing those loans can push concentration ratios up rather than down. That has made extensions and loan sales a bigger part of the toolkit, and it's also made modify-and-extend decisions an active point of examiner attention, because systematic use of extensions to avoid reporting past-due status can suppress the metrics that are supposed to trigger higher reserves, per FDIC FIL-64-2023. The refinancing wall running through 2028 will get resolved one deal at a time, through a triage shaped by asset quality, sponsor liquidity, how much balance sheet capacity a given lender actually has left, and whether a sponsor is willing to use more than one tool in the capital stack. Concentration limits are one of the quiet mechanisms doing the sorting in that triage, even though nobody puts it on the term sheet. Per the MBA's 2025 Commercial Real Estate Survey of Loan Maturity Volumes, released at the Commercial/Multifamily Finance Convention and Expo, a substantial volume of commercial mortgages is scheduled to mature in 2026, followed by a large volume in 2027, with many pushed forward from 2023–2024 as borrowers and lenders waited for rate stabilization. The Mortgage Bankers Association estimates USD 957 billion of U.S. commercial real estate debt matured in 2025, with a similar volume due in 2026, per Deluair Consultancy.
Concentration Limits in Lender Behavior Across Asset Classes and Markets
The market right now isn't short on capital, it's short on lenders willing to say yes to a specific deal at a specific moment. Banks, life insurance companies, debt funds, and agency lenders all have money to place, but each one is being deliberate about where it goes, and that deliberateness traces directly back to concentration math.
Office shows this most starkly. It has the lowest quote efficiency of any major asset class on the LoanBase platform heading into 2026: fewer quotes come back per submission and more responses cite valuation uncertainty or vacancy risk outright. When quotes do come back, they carry tighter leverage limits and higher DSCR thresholds, appearing as risk repricing in real time. Trepp data confirms office delinquencies remained the highest of any major CRE asset class entering 2026, and Reuters has reported that regional banks keep trimming office exposure even as other sectors stabilize. Multifamily and industrial are at the opposite end, drawing the broadest lender participation of any property type, with industrial lending volume on the LoanBase platform up more than 150% comparing the most recent six-month stretch to the one before it. Industrial's appeal is straightforward: steady tenant demand and simpler underwriting, the exact opposite of what makes office hard to place right now.
Geography tells a version of the same story. In Chicago and Cook County, lender quote yield is near 27%, well below the roughly 42% average across major U.S. metros, a gap tied to tax volatility, regulatory complexity, and slower legal timelines rather than anything about the deals themselves. New York multifamily runs even lower, with quote yield under 16%, as lenders stay cautious about rent regulation exposure, rising expenses, and long-term valuation uncertainty in the core boroughs. A seasoned sponsor can feel this shift even with a strong deal in hand: one multifamily owner with stabilized Texas assets and a DSCR above 1.4x still came back with a best offer of only 61% LTV and heavy reserve requirements, because the lender's own portfolio math had moved.
Private capital has stepped into the gap. Over 63% of deals submitted through the LoanBase platform in the fourth quarter routed to debt funds and private lending groups, and those lenders are closing roughly twice as fast as traditional banks. Agencies, meanwhile, are holding pricing near 5% on stabilized multifamily, which has started pulling refinance activity back from borrowers who had been sitting on the sidelines through the worst of the rate volatility.
Displaced Deal Flow: Private Credit, CRE CLOs, and CMBS
Alternative debt made up roughly a quarter of all U.S. CRE lending volume in 2025, far above the average of the prior decade, according to Northspyre's PropTech Outlook citing Deloitte, and that's not a marginal shift, it's a structural one. Banks and private lenders increasingly aren't competing for the same slice of the same deal anymore. The market has sorted itself by risk position, by property type, and by where a deal sits in its lifecycle.
CRE CLOs are one of the clearest expressions of that sorting. Nearly all issuers are private credit firms rather than banks, and the collateral is generally transitional property where the sponsor still has a lease-up or value-add plan to execute. Issuance peaked at a multibillion-dollar level in 2021, fell sharply after that, and has since rebounded to $30.0 billion in 2025 and $13.5 billion in the first quarter of 2026 alone, a strong opening to the year. These vehicles aren't free of the same discipline banks operate under. Variable funding note structures inside CRE CLOs carry their own concentration limits by sponsor, by geography, and by loan-to-value, so the same logic constraining bank balance sheets simply reappears one layer down, inside the private credit vehicle itself.
CMBS issuance told a similar story of overflow. Capacity clearly exists. It just comes priced and structured differently than a bank term sheet, with different covenants, different leverage assumptions, and a different tolerance for transitional risk. CMBS issuance surged in 2025, with year-to-date volume reaching $115.2 billion through November, the highest since 2007, sourced from a research brief, as securitization markets absorb volume that bank balance sheets cannot hold. Private credit expansion saw the Preqin direct lending universe expand by roughly 25% between end-2023 and end-2025, with assets above USD 1.7 trillion globally, per Deluair, priced and structured differently than bank debt.
What sponsors and brokers can do differently knowing how lender portfolios work
A lender passing on a well-underwritten deal is often answering a portfolio math question, not a credit question, and once a sponsor or broker internalizes that distinction, it changes how the next submission gets built and where it gets sent. Treating every "no" as a verdict on the deal itself means missing the actual reason and wasting time resubmitting a good deal to the wrong shelf.
The practical move is to segment lenders by where they sit in their own portfolio cycle, not by brand name or by who answered the phone last quarter. Which banks are already bumping up against their internal office or construction sub-segment caps this month? Which lenders carry geographic limits that make a Chicago or New York multifamily deal a structural pass no matter how clean the numbers look? Life insurance companies and agency lenders, for their part, still compete hardest for well-located, stabilized multifamily and industrial assets, the same property types where bank appetite is also tight, just for a different reason rooted in concentration math rather than credit hesitation. Knowing which constraint is actually in play, regulatory ceiling, internal sub-segment cap, or genuine credit concern, separates a broker who gets a deal placed on the first try from one still working through a stack of rejections that were never really about the deal.
Sources
- CRE Concentration Risk in Banking: A Data Analysis
- CRE Concentration Risk: How to Build the Policy Framework Your OCC or FDIC Examiner Will Actually Test | RiskTemplates
- The 2026 Distressed Debt Cycle: Refi Wall, CRE Stress, and CLO Reflexivity: Deluair Consultancy
- sisummer2022 article01
- FIRST US BANCSHARES, INC. - Form ARS - FY2025
- Western New England Bancorp, Inc. - Form ARS - FY2025
- Federal Register :: Concentrations in Commercial Real Estate Lending, Sound Risk Management Practices
- 1 Managing Commercial Real Estate Concentrations in a Challenging Economic